
Master market sizing with real formulas, calculation methods, VC evaluation criteria, and startup examples. Create your market sizing deck.
Table of Contents
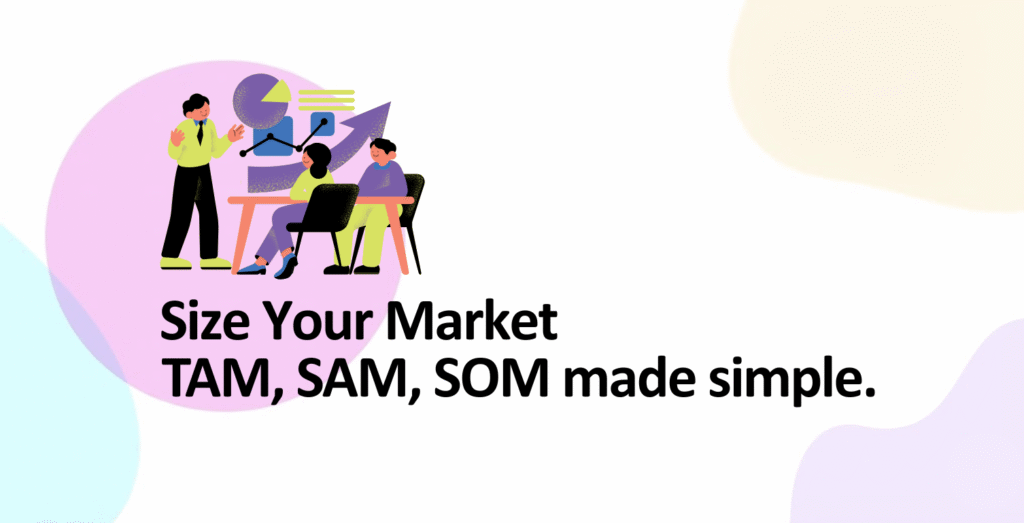
Why Market Sizing Matters for Fundraising
VCs ask one question before almost anything else: “What’s your market size?”
Why? Because they’re not betting on your product. They’re betting on the market opportunity. A perfect product in a ₹100 crore market is worth less than an okay product in a ₹10,000 crore market.
This is where TAM, SAM, and SOM come in. These three metrics tell a complete story:
- TAM: How big is the opportunity if you execute perfectly?
- SAM: How much of that opportunity can you realistically reach?
- SOM: How much can you actually capture in the next 3-5 years?
Get these numbers wrong, and VCs won’t take you seriously. Get them right, and you’ve told a data-driven story that investors understand.
Market sizing isn’t about guessing big. It’s about showing you understand your market deeply enough to build a sustainable, investable business.
TAM, SAM, SOM Definitions (Clear Breakdown)
Let’s start with clear definitions that VCs actually use:
TAM: Total Addressable Market
The total revenue opportunity available in the market if you captured 100% of customers and faced zero competition. It’s the “if everything goes perfectly” number.
Think of it as: “If every person on Earth who could possibly want this product bought from us at full price, how much revenue would we make?”
Example: Email Marketing Software
If there are 10 million small businesses worldwide, and they each spend an average of ₹3,650 per year ($44) on email marketing, then:
TAM = 10M businesses × ₹3,650 = ₹36,500 crores
SAM: Serviceable Addressable Market
The portion of TAM that you can realistically reach with your product, distribution, and business model. It accounts for geography, pricing, channels, and competition.
Think of it as: “Given our product, resources, and go-to-market strategy, which part of the TAM can we actually serve?”
Example: Email Marketing Software (Continued)
Your software is best for small businesses in North America and Europe (not developing countries due to pricing). These regions represent 40% of the TAM.
SAM = TAM × 40% = ₹36,500 crores × 0.40 = ₹14,600 crores
SOM: Serviceable Obtainable Market
The realistic market share you can capture within SAM in the next 3-5 years, given competition, your execution, and market conditions.
Think of it as: “What’s a realistic market share we can actually win?”
Example: Email Marketing Software (Continued)
You’re competing against 50+ players (Mailchimp, Brevo, HubSpot, etc.). Realistic market share: 2% in 5 years.
SOM = SAM × 2% = ₹14,600 crores × 0.02 = ₹292 crores (₹2,920 million)
This becomes your revenue target: ₹292 crores in year 5.
The Relationship Between TAM, SAM, SOM
Think of it as a funnel:
- TAM: The entire ocean
- SAM: The part of the ocean you can fish in (your geography, customer segment, price point)
- SOM: What you actually catch in the next few years (realistic given competition and execution)
Three Methods to Calculate Market Size
There are three standard approaches to calculating TAM. Each has strengths and weaknesses. Most founders use a combination.
Method 1: Top-Down Approach (Fastest, Less Accurate)
Start with total market size from industry reports, then segment down to your niche.
Formula
Steps:
- Find total market size from reports (Gartner, Forrester, Statista, IMARC Group)
- Identify what percentage is your target segment
- Multiply the two
Real Example: Recruitment SaaS for D2C Brands
Step 1: Global HR software market = ₹2,50,000 crores (from Gartner 2024 report)
Step 2: D2C brands represent ~5% of that market (they’re a specific niche)
Step 3: TAM = ₹2,50,000 crores × 5% = ₹12,500 crores
Pros: Fast (30 minutes), uses credible data
Cons: May overestimate (market reports include all segments, not just yours)
Method 2: Bottom-Up Approach (Slower, More Accurate)
Count actual potential customers, multiply by average revenue per customer. Uses first-party data.
Formula
Steps:
- Estimate total addressable customers (use census data, industry reports, surveys)
- Calculate average annual revenue per customer (ARPC) – what they’d pay annually
- Multiply
Real Example: E-commerce Analytics Platform
Step 1: Research: 2 million e-commerce stores in US/Canada/UK (from industry data)
Step 2: Average spend on analytics tools: ₹36,500/year ($440)
Step 3: TAM = 2M × ₹36,500 = ₹73,000 crores
Pros: Based on actual customer data, very accurate if assumptions are right
Cons: Requires detailed research (1-2 weeks), assumptions can be wrong
Method 3: Value Theory Approach (For Disruption)
Calculate based on the value you deliver, not market size. Useful when you’re creating a new category.
Formula
Steps:
- Calculate value created (cost savings, revenue generated, time saved)
- Estimate willingness to pay (% of value saved)
- Count potential customers
- Multiply
Real Example: AI-Powered Cold Email Tool
Step 1: Value created: Saves 5 hours/week for sales teams (replaces hiring 1 person @ ₹36,500/month cost)
Step 2: Willingness to pay: 20% of savings = ₹7,300/month = ₹87,600/year
Step 3: Potential customers: 500,000 sales teams globally
Step 4: TAM = ₹87,600 × 500,000 = ₹4,38,000 crores
Pros: Captures value, not just market size. Great for disruption stories
Cons: Can be inflated (assumes 100% of value is captured)
Which Method to Use?
| Situation | Best Method | Why |
|---|---|---|
| Existing market, fast analysis | Top-Down | Quick, uses published data |
| B2B SaaS, specific customer count | Bottom-Up | Most accurate for countable businesses |
| New category, disruption story | Value Theory | Shows transformation potential |
| Investor presentation | All three combined | Shows you thought deeply about it |
Pro tip: Use all three methods and show triangulation. If all three methods converge on similar TAM, VCs believe your number. If they diverge wildly, VCs think you didn’t do your homework.
What VCs Look For in Market Sizing
Market sizing isn’t just about the number. It’s about what that number signals to VCs.
VC Evaluation Criteria (In Priority Order)
- TAM Size: Is it big enough? Minimum TAM: ₹1,000 crores for Series A. Below that, most VCs pass.
- Realism of Assumptions: Are your assumptions defensible? Can you back them up with real data?
- SAM Clarity: Do you understand which segment you’re targeting? Vague “total market” talk signals immaturity.
- SOM Ambition + Reality: Is your 5-year revenue goal achievable? Too conservative (0.01% market share) signals weak execution belief. Too aggressive (20% market share) signals unrealistic thinking.
- Market Growth: Is the market growing? VCs prefer 10-15%+ annual growth. Flat/shrinking markets are harder to succeed in.
Red Flags VCs See
- TAM under ₹500 crores (not big enough to fund)
- TAM number with no sources or methodology (“The market is ₹10,000 crores” – where’s the evidence?)
- Including TAM that’s not addressable (“Our market includes everyone on Earth” – not realistic)
- SOM that’s 10%+ market share in year 3 (only true giants achieve this)
- Assuming zero competition (Mailchimp, Stripe, Figma, etc. exist)
How VCs Actually Evaluate Your SOM
VCs work backwards from your SOM to evaluate whether the business model works:
| SOM Revenue Goal | Implied Annual Customers | VC Assessment |
|---|---|---|
| ₹10 crores (Year 3) | ~400 customers (if ₹25 lakh ACV) | “This is achievable but small” |
| ₹50 crores (Year 5) | ~2,000 customers (if ₹25 lakh ACV) | “This is interesting, fundable” |
| ₹200 crores (Year 5) | ~8,000 customers (if ₹25 lakh ACV) | “This could be a unicorn candidate” |
| ₹1,000+ crores (Year 5) | ~40,000+ customers | “This is category leader territory” |
VCs evaluate whether you can hit your SOM with:
- Your sales team size (implied CAC)
- Your product roadmap (does it support scale?)
- Your market positioning (vs competitors)
- Market growth rates (is TAM actually growing?)
Real Startup Examples (With Numbers)
Example 1: B2B SaaS – Recruitment Platform for D2C
Company: Imagine a recruitment automation platform targeting D2C brands in India.
TAM Calculation (Bottom-Up)
Step 1: Research: 50,000 D2C brands in India (from industry reports)
Step 2: Average HR software spend: ₹36,500/year per company
TAM = 50,000 × ₹36,500 = ₹18.25 crores
SAM Calculation
You target mid-market D2C brands (companies with 50-500 employees). These have higher budgets and better payoff for automation.
Research: ~15,000 mid-market D2C brands in India
Average spend (higher tier): ₹72,500/year
SAM = 15,000 × ₹72,500 = ₹10.87 crores
SOM Calculation
You’ve validated product-market fit with 50 customers. Realistic growth: 2% market share in 5 years.
SOM = SAM × 2% = ₹10.87 crores × 0.02 = ₹21.74 lakh
Or: 300 customers × ₹72,500 average = ₹21.75 crores revenue in year 5
VC Assessment: “TAM is too small (₹18 crores). Even at 100% market share, this isn’t a billion-dollar company. Pivot to larger market or add more products.”
Example 2: E-commerce Analytics – Larger TAM
Company: Analytics platform for e-commerce stores globally.
TAM Calculation (Bottom-Up)
Total e-commerce stores globally: 20 million (active online stores)
Average analytics software spend: ₹36,500/year
TAM = 20M × ₹36,500 = ₹7,30,000 crores
SAM Calculation
You focus on small-medium e-commerce (₹50L – ₹50 crores annual revenue). These are growth-focused and willing to spend.
Market research: 5 million SME e-commerce stores
Average spend (SME segment): ₹72,500/year
SAM = 5M × ₹72,500 = ₹3,62,500 crores
SOM Calculation
Competing against Shopify, Google Analytics, Littledata. Realistic: 1% market share in 5 years.
SOM = SAM × 1% = ₹3,62,500 crores × 0.01 = ₹3,625 crores
VC Assessment: “TAM is ₹7.3 lakh crores, SOM is ₹3,625 crores. This is fundable. Shows potential for a ₹1,000+ crore company. Compelling story.”
Templates and Tools for Market Sizing
Template 1: Simple TAM, SAM, SOM Calculator (Excel/Sheets)
Column Structure
| Column | What to Fill In | Example |
|---|---|---|
| Total Addressable Customers | Count from research | 20,000,000 |
| Average Annual Revenue Per Customer | Average spend on category | ₹36,500 |
| TAM (= Customers × ARPC) | Auto-calculated | ₹7,30,000 crores |
| SAM (% of TAM) | Your reachable segment | 25% |
| SAM Revenue (= TAM × %) | Auto-calculated | ₹1,82,500 crores |
| Target Market Share (year 5) | Realistic % of SAM | 2% |
| SOM Revenue (= SAM × %) | Auto-calculated | ₹3,650 crores |
Data Sources for Market Research
Free/Cheap Sources:
- Industry reports from Gartner, Forrester, IDC (often quoted in press releases)
- Government census data (NSIC, MSME ministry for Indian startups)
- Trade association reports (search “[your industry] association annual report”)
- Company databases (ZoomInfo free tier, Hunter.io)
- Crunchbase (for competitor analysis)
Paid Sources (₹5,000-50,000):
- Statista (₹15,000/year) – Industry reports and statistics
- IBISWorld (₹5,000-10,000) – Industry-specific deep dives
- Gartner Magic Quadrant (₹20,000+) – Category research
- McKinsey Research (₹10,000+) – Strategic insights
Pro Tips for TAM, SAM, SOM Presentations
- Show your methodology explicitly. “We used bottom-up approach: 20M stores × ₹36,500 ARPC”
- Include sources. “Source: Statista 2024 E-commerce Report” not just a number
- Segment your market. Show different customer types have different spend (SMB vs Enterprise)
- Compare to competitor SOM. If competitors target same market and have 5% share, 2% is realistic for you
- Show market growth. TAM growing 15%+ annually is more valuable than flat market
- Address total addressable opportunity, not just revenue. Include partnerships, ecosystem plays
What to Avoid
- Vague TAM (“The market is huge”)
- TAM that includes non-customers (“Everyone needs productivity” – but not everyone will buy from you)
- Assuming zero competition (acknowledge Stripe, Mailchimp, etc.)
- SOM that’s unrealistic (10%+ market share in 3 years is unicorn territory, not normal)
- Conflating TAM with your company’s potential (TAM is market, your SAM/SOM is more realistic)
Calculate Your Market Size Today
Your market size is one of the first questions VCs will ask. Getting it right takes 2-4 hours of research, but signals you understand your opportunity deeply.
Use the bottom-up method. Find your total addressable customers. Multiply by average revenue. Present with sources. That’s it.
Resources and Data Sources for Market Sizing
Market Research Reports
- Statista – Statistics and market data (₹15,000/year)
- Gartner – Industry research and Magic Quadrant
- IBISWorld – Industry-specific reports (₹5,000-10,000)
- McKinsey Research – Strategic insights
- Forrester – Tech and customer research
Free Data Sources
- Census India – Population and demographic data
- Data.world – Open datasets and research
- Kaggle – Datasets for analysis
- Crunchbase – Competitor and market data
- ZoomInfo – Company database (free tier limited)
Industry-Specific Associations
- NASSCOM (India tech industry)
- IAMAI (Internet and Mobile Association of India)
- MSME Ministry (Small business data)
- DPIIT (Startup India official data)
- Search “[Your Industry] Association” + “annual report”